Related links
Framework Core functionality
- Client-defined object attributes
- Common Libraries
- Default server methods
- Export collection of objects
- AyMINE Framework Server
- The AyMINE licence model
- System Rights
- Import collection of objects
- Multi tenant Architecture
- Strings and translations
- Event-based architecture
- System messaging
- User sessions
- User defined fields
Libraries & Lincences
Module - support for management
Front-End Scripting
System Management
Task Management Module
Task & Task pattern
Mobile & Web Application
- clientprogramming_fevaldataobject
- userinterface-objectstructure
- cliplink
- npmlibraries
- fclip
- drag-drop
- AyMINE Application
- objectdefinition_inlineedit
- npmlibraries_stringlibrary
- clientprogramming
- mobileapplication
- languagesupport
- objectdefinition_multiupdate
- clientprogramming_fevalglobal
- clientprogramming_fevallanguage
- clientprogramming_fevaluser
- objectdefinition_viewdefinition
- offlineobjects
- System console
- Runtime debugging
- objectdefinition_detailview
CMS - Content Management & Web API services
FI - Finance Management
Sales & Asset management
Sales related services
Description of a part of the AM module - sales partHR - Human Resources
Runtime debugging
Framework supports runtime debugging both in server and in the client application.
Notes:
- Debugging in runtime describes analytical tools available to make analysis of the system behaviour during the runtime operation without direct affecting the processing. Apart of that, traditional debugging during the development is possible both for client and server.
- Commands to start system terminal and other commands available in the AyMINE application are not published here and are provided the development teams on request.
Start runtime debugging
The debugging mode can be started only by developer or a person with developer right using the system terminal command.
Developer can also request non-developer user to temporarily start debugging in his session to analyse system behaviour under general user account.
Note: The debugging data never contains password but can contain proprietary system data loaded by user. That’s why developer can never start runtime debugging without user’s permission
Stop debugging
Runtime debugging is always stopped when user logout or restart application.
Application debugging
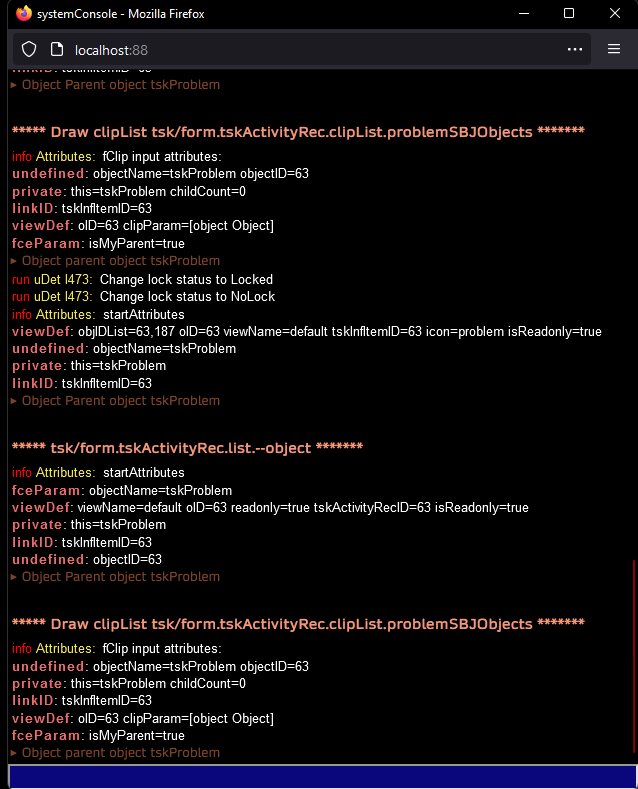
Application publish general runtime data to the application console whenever console is open.
Remember:
- Application terminal affects the system performance.
- Terminal never affects processing results
Debug modes
Debug modes are switched in the application terminal. Can also be switched directly using the command input line.
debug off – default mode
- Only general information what views are opened is provided.
- All error messages are published
debug on
- Information about results of method evaluation are reported
- Information about all calling are provided
debug verbose

Verbose mode provides several details about processing. Mode is designed to be used only for short time to start a problematic part of the application. It significantly affects the performance.
Verbose mode runs in two variants: without filter and with filter:
- Without filter: It displays information about each command evaluation but without details about the processing.
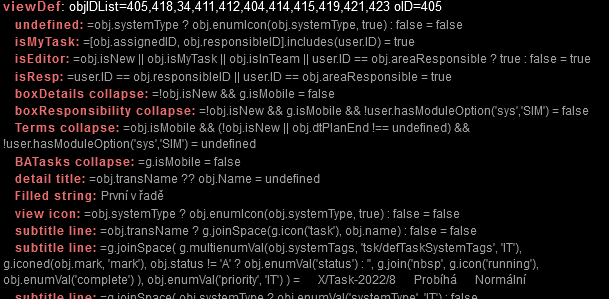
“ With filter: In this mode it displays all input attributes for processing of the task that matches filter
The sequence of commands:
debug verbose
verbose name
verbose tskTask
starts the debug verbose mode and adds two strings (name and tskTask) to the filter. If any of them occurs in the evaluated command from jsonc object description. All evaluation details are displayed at the console.
Information about evaluation of commands that does not match filter data are ignored. The filter reduces generated information but also add additional information for selected commands.
The filter is cleared using command
verbose clear
Runtime debugging on server
Debuging on server is set together with debugging on client and is always active only for user’s that has selected degugging on. User the same command debug on/off/verbose to activate the server logging.
Data generated by server
When debugging is set:
- server generates data about each called request and returned data to the error_log file.
- server stores information about all SQL command to the error_log (regardless of the result; in case of error, information about the erroneous query is stored anyway.)
Debug on also reports selects used to get data for universal list views. It might contain
Back-end Developers shall setup internal function report in regards to the settings. For logged user the settings is available using the globally-available object DBO:
DBO::makeLog() : bool    // return true when debug is not off
DBO::debugMode() : ayDebugMode   // returns the debug status
How functions are used and what data are reported depends on the modules’ developer’s decision.
Store data to the database log
Debug data can be store to the error_log using the system function log_error or in the system database log using function DBO::log, example::
if (DBO::makeLog())
   DBO::log(
      __CLASS__ . '  Ixxx', 'Log short infor ',
      "Log Info",
      msgType::log,
      msgSeverity::info
   );
See function documentation for more details.
Database log:
- Consumes more resources than error_log
- Information are available through the application (System errors) and more easily filtered